Nebraska
Maps & Population Facts
Housing Estimates
Nebraska is the 37th most populated state and 15th largest by land area. Nebraska has a strong agriculture economy producing over 6 billion dollars in corn and 2 billion dollars in soybeans annually. The state has 45 million acres utilized for farming, which makes up 92% of the total land area.
The state has one of the lowest unemployment rates and one of the highest labor force participation rates in the United States. The cost of living in Nebraska is lower compared with other states.
Income
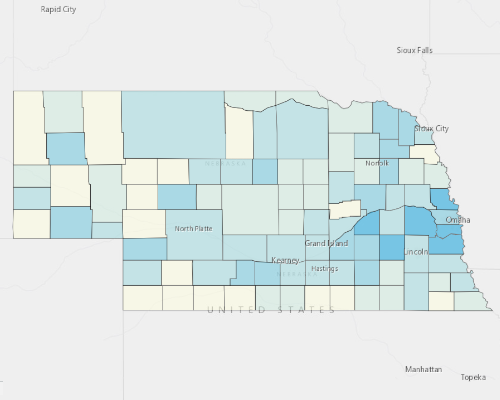
Households in the state of Nebraska earn slightly less money than the national median income, averaging 1% less per household.
Housing
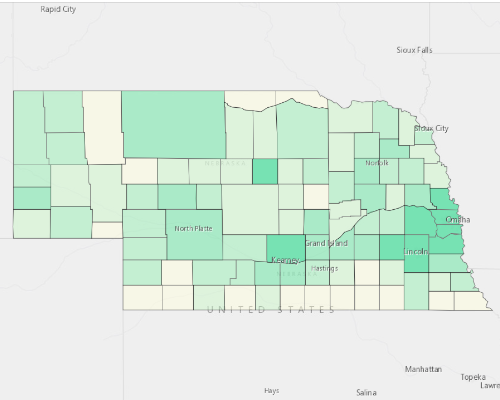
Nebraska has a median house price of $155,800. The cost of owning a home in Nebraska is less than most states. The cost of renting in Nebraska is 21% less than the national average.
| Percent | Ranking | |
|---|---|---|
| Renter Occupied Households | 34% | 26th |
| New Construction (Built after 2000) | 17% | 33rd |
Demographics
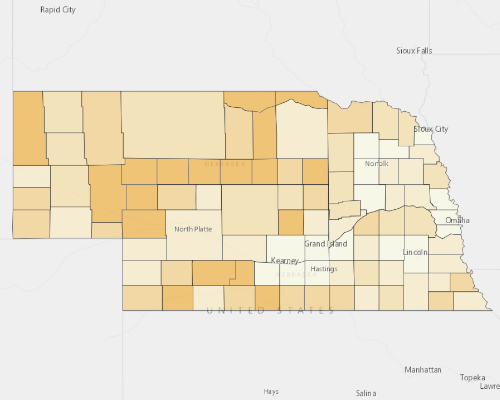
The median age in the state is 37. The age of the general population in Nebraska is comparable with other US states.
Nebraska ranks average for having an educated population. The percent of residents who have a college degree is comparable with other states.
Housing Data
| Nebraska | USA | |
| Median Property Value | 155,800 | 217,600 |
| Median Mortgage Payment | 1,334 | 1,513 |
| Median Gross Rent | 801 | 1,012 |
| Property Vacancy | 9.9% | 12.6% |
| % Renters | 34% | 36% |
| Residents per Sq. Mi. | 25 | 93 |
| Nebraska | USA | |
| Median Household Income | 59,970 | 60,336 |
| Median Individual Income | 33,314 | 33,646 |
| Median Income (Full-Time) | 44,803 | 46,881 |
| Median Age | 36.5 | 38.1 |
| Labor Participation | 69.6% | 62.8% |
| Attained College Degree | 31.7% | 32.0% |
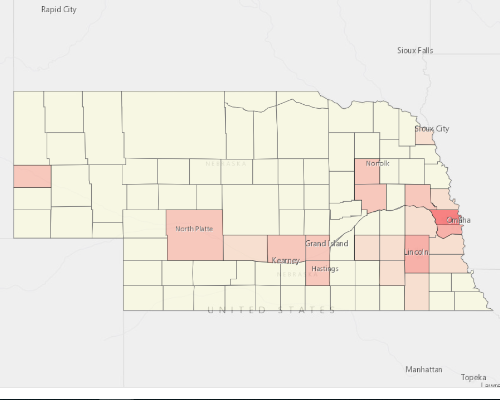
Population Density Analysis




Demographics
Most Populated Cities
| 1. | Omaha | 463,081 |
| 2. | Lincoln | 277,315 |
| 3. | Bellevue Precinct | 53,040 |
| 4. | Grand Island | 51,042 |
| 5. | Chicago Precinct | 32,453 |
Highest Household Income
| 1. | Tyrone Precinct | 204,635 |
| 2. | Millard Precinct | 159,583 |
| 3. | Lone Tree | 155,625 |
| 4. | Blackwood Precinct | 151,500 |
| 5. | North Bluff Precinct | 150,602 |
Highest Home Value
| 1. | Garfield Precinct | 875,000 |
| 2. | Brush Creek Precinct | 456,300 |
| 3. | Paddock | 428,900 |
| 4. | Precinct 8 | 413,000 |
| 5. | Brace Precinct | 400,000 |
Highest Gross Rent
| 1. | Precinct 6 | 3,063 |
| 2. | Fairview Precinct | 2,617 |
| 3. | Laplatte Ii Precinct | 1,801 |
| 4. | Papillion Second Ii Precinct | 1,654 |
| 5. | Richland V Precinct | 1,647 |