New Jersey
Maps & Population Facts
Housing Estimates
New Jersey is known for its beaches and being home to Atlantic City. New Jersey has one of the highest corporate tax rates (for highest tax brackets) in comparison with other states.
Income
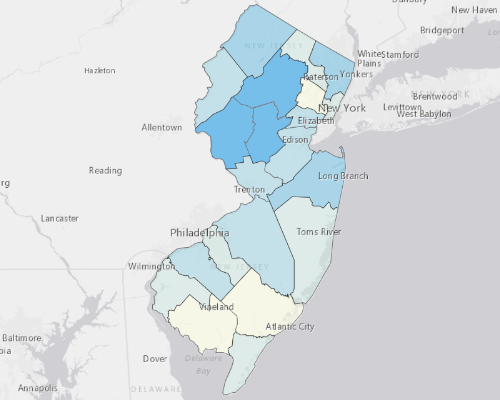
Households in the state of New Jersey earn significantly more money than the national median income, averaging 33% higher per household.
Housing
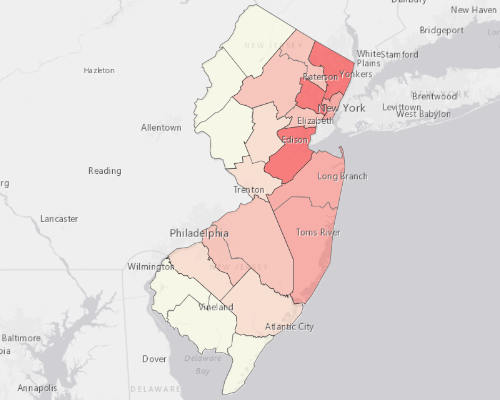
New Jersey has a median house price of $334,900. The cost of homeownership is higher than most states. The cost of renting in New Jersey is 27% more than the national average.
| Percent | Ranking | |
|---|---|---|
| Renter Occupied Households | 36% | 13th |
| New Construction (Built after 2000) | 12% | 44th |
Demographics
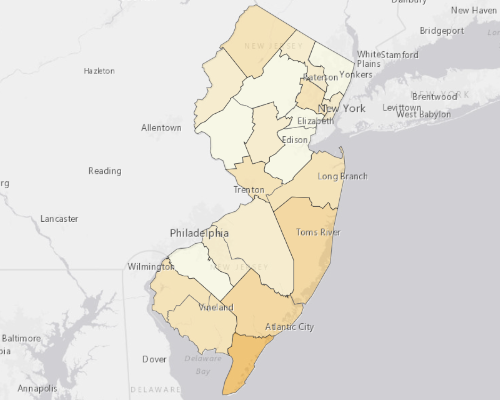
The median age in the state is 40. The age of the general population in New Jersey is comparable with other US states.
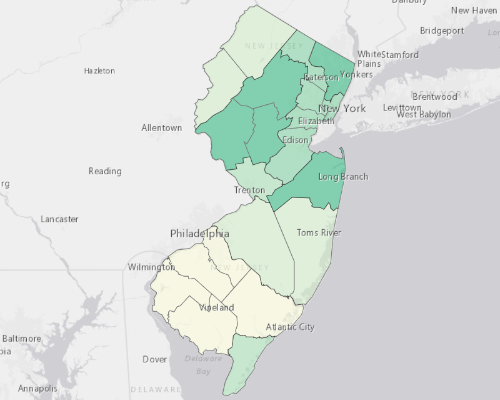
New Jersey ranks in the highest of the nation for having an educated population. The state has significantly more college graduates per resident than most states.
Housing Data
| New Jersey | USA | |
| Median Property Value | 334,900 | 217,600 |
| Median Mortgage Payment | 2,348 | 1,513 |
| Median Gross Rent | 1,284 | 1,012 |
| Property Vacancy | 11.0% | 12.6% |
| % Renters | 36% | 36% |
| Residents per Sq. Mi. | 1,211 | 93 |
| New Jersey | USA | |
| Median Household Income | 80,088 | 60,336 |
| Median Individual Income | 41,556 | 33,646 |
| Median Income (Full-Time) | 58,150 | 46,881 |
| Median Age | 39.8 | 38.1 |
| Labor Participation | 62.7% | 62.8% |
| Attained College Degree | 39.7% | 32.0% |
Population Density Analysis


Demographics
Most Populated Cities
| 1. | Newark | 282,803 |
| 2. | Jersey City | 265,932 |
| 3. | Paterson | 147,890 |
| 4. | Elizabeth | 129,363 |
| 5. | Edison | 102,304 |
Highest Household Income
| 1. | Millburn | 202,862 |
| 2. | Essex Fells | 200,875 |
| 3. | Glen Ridge | 196,821 |
| 4. | North Caldwell | 187,470 |
| 5. | Mendham Township | 185,882 |
Highest Home Value
| 1. | Saddle River | 1,883,500 |
| 2. | Rockleigh | 1,703,100 |
| 3. | Spring Lake | 1,420,900 |
| 4. | Sea Girt | 1,404,000 |
| 5. | Stone Harbor | 1,209,100 |
Highest Gross Rent
| 1. | Haworth | 3,450 |
| 2. | Englewood Cliffs | 3,179 |
| 3. | Demarest | 3,147 |
| 4. | Essex Fells | 3,018 |
| 5. | Fanwood | 2,708 |