Oregon
Maps & Population Facts
Housing Estimates
Oregon is 27th most populated state and 9th largest by land area. The state ranks average in most categories including income and educational attainment, but has a higher cost of living.
Agriculturally, the state has a wide assortment of crops and produces over 300 million dollars annually in potatoes, blueberries and pears. The state has experienced high population growth, with a 9% increase since 2010.
Income
Households in the state of Oregon earn slightly less money than the national median income, averaging % less per household.
Housing
Oregon has a median house price of $319,200. The cost of homeownership is higher than most states. The cost of renting in Oregon is 7% more than the national average.
| Percent | Ranking | |
|---|---|---|
| Renter Occupied Households | 37% | 8th |
| New Construction (Built after 2000) | 20% | 27th |
Demographics
The median age in the state is 39. The age of the general population in Oregon is comparable with other US states.
Oregon ranks better than average for having an educated population. The state has more college graduates per resident than most states.
Housing Data
| Oregon | USA | |
| Median Property Value | 319,200 | 217,600 |
| Median Mortgage Payment | 1,629 | 1,513 |
| Median Gross Rent | 1,079 | 1,012 |
| Property Vacancy | 9.3% | 12.6% |
| % Renters | 37% | 36% |
| Residents per Sq. Mi. | 44 | 93 |
| Oregon | USA | |
| Median Household Income | 60,212 | 60,336 |
| Median Individual Income | 32,137 | 33,646 |
| Median Income (Full-Time) | 46,814 | 46,881 |
| Median Age | 39.3 | 38.1 |
| Labor Participation | 62.2% | 62.8% |
| Attained College Degree | 33.7% | 32.0% |
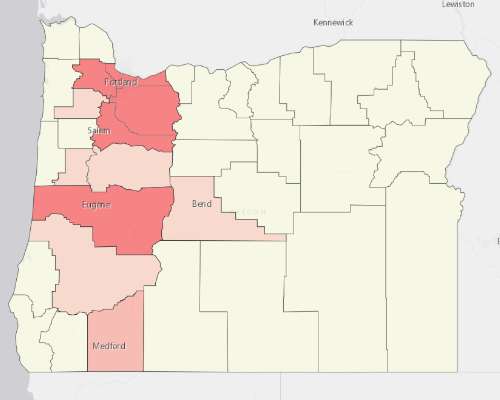
Population Density Analysis


Demographics
Most Populated Cities
| 1. | Portland East | 499,503 |
| 2. | Beaverton-Hillsboro | 435,183 |
| 3. | Northwest Clackamas | 265,226 |
| 4. | Eugene-Springfield | 262,715 |
| 5. | Salem | 235,466 |
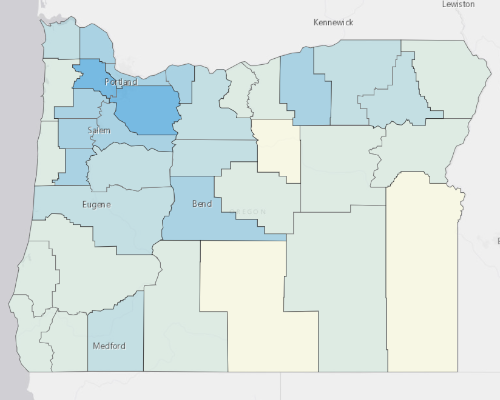
Highest Household Income
| 1. | Redland | 87,888 |
| 2. | Powell Butte | 87,241 |
| 3. | Coast Range | 85,739 |
| 4. | Rockcreek | 83,748 |
| 5. | Southeast Jackson | 82,708 |
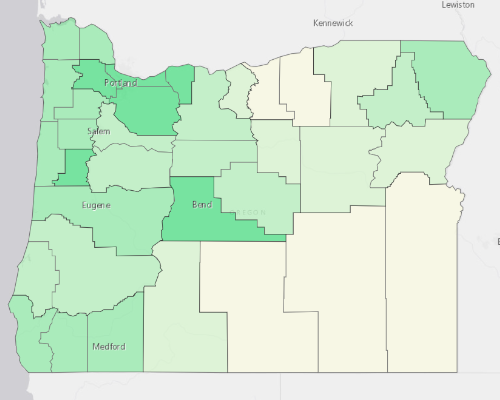
Highest Home Value
| 1. | Skyline | 570,900 |
| 2. | Portland West | 480,200 |
| 3. | Imnaha | 477,800 |
| 4. | Tumalo | 470,700 |
| 5. | Southeast Jackson | 467,400 |
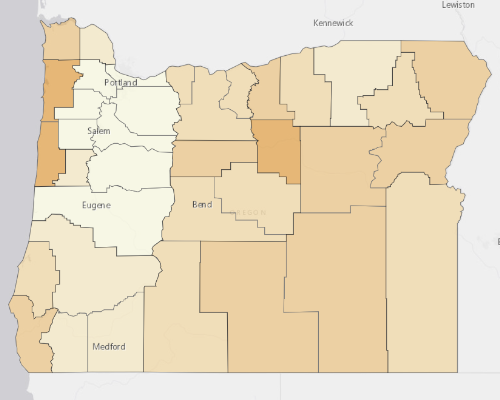
Highest Gross Rent
| 1. | Skyline | 1,603 |
| 2. | Powell Butte | 1,583 |
| 3. | North Albany | 1,364 |
| 4. | Keno | 1,323 |
| 5. | Beavercreek | 1,314 |