South Carolina
Maps & Population Facts
Housing Estimates
South Carolina is the 23rd most populated state, despite being the 11th smallest by land area. South Carolina has a warm climate and attracts many tourists with its beaches and many golf courses. Myrtle Beach and Hilton Head are popular tourist destinations.
South Carolina has a population that is largely spread out between Charleston, Columbia and Greenville. South Carolina has a labor force participation rate that is one of the worst in the nation, but still has experienced large population growth since 2010 adding over 450,000 residents.
Income
Households in the state of South Carolina earn less money than the national median income, averaging 16% less per household.
Housing
South Carolina has a median house price of $161,800. The cost of owning a home in South Carolina is less than most states. The cost of renting in South Carolina is 16% less than the national average.
| Percent | Ranking | |
|---|---|---|
| Renter Occupied Households | 31% | 37th |
| New Construction (Built after 2000) | 27% | 8th |
Demographics
The median age in the state is 39. The age of the general population in South Carolina is comparable with other US states.
South Carolina ranks worse than average for having an educated population. The state has less college graduates per resident than most states.
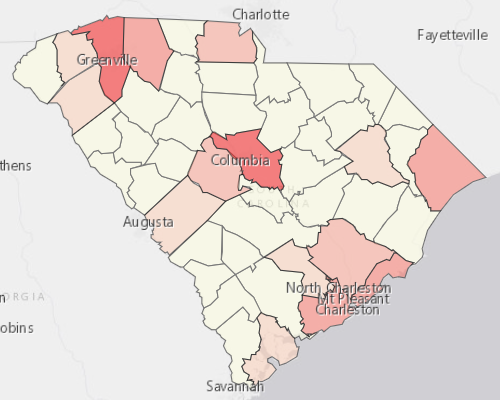
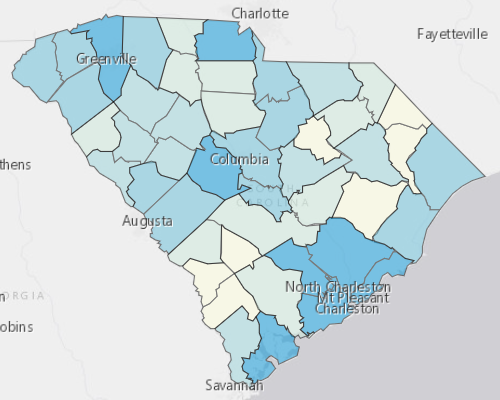
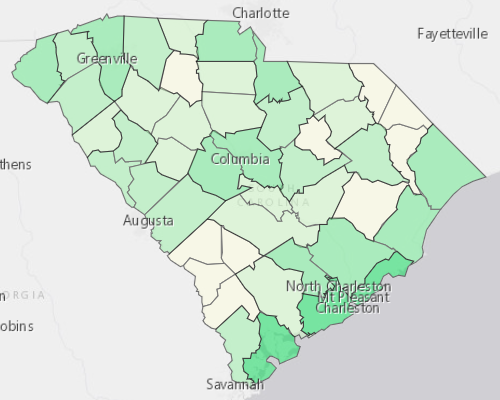
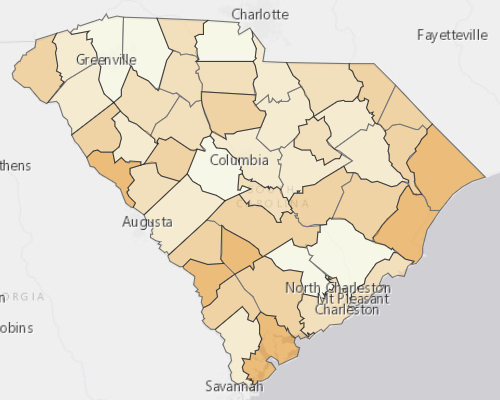
Housing Data
| South Carolina | USA | |
| Median Property Value | 161,800 | 217,600 |
| Median Mortgage Payment | 1,195 | 1,513 |
| Median Gross Rent | 848 | 1,012 |
| Property Vacancy | 16.6% | 12.6% |
| % Renters | 31% | 36% |
| Residents per Sq. Mi. | 169 | 93 |
| South Carolina | USA | |
| Median Household Income | 50,570 | 60,336 |
| Median Individual Income | 30,021 | 33,646 |
| Median Income (Full-Time) | 40,486 | 46,881 |
| Median Age | 39.4 | 38.1 |
| Labor Participation | 58.3% | 62.8% |
| Attained College Degree | 28.0% | 32.0% |
Population Density Analysis




Demographics
Most Populated Cities
| 1. | Greenville | 284,828 |
| 2. | Columbia | 169,158 |
| 3. | Goose Creek-Hanahan | 133,101 |
| 4. | Summerville | 131,364 |
| 5. | Spartanburg | 121,185 |
Highest Household Income
| 1. | Kiawah Island-Seabrook Island | 120,078 |
| 2. | Wando | 91,129 |
| 3. | Fort Mill | 88,612 |
| 4. | Mount Pleasant | 87,668 |
| 5. | Chapin | 80,861 |
Highest Home Value
| 1. | Kiawah Island-Seabrook Island | 861,500 |
| 2. | Charleston Central | 477,200 |
| 3. | Hilton Head Island | 459,000 |
| 4. | Mount Pleasant | 419,100 |
| 5. | Wando | 386,200 |
Highest Gross Rent
| 1. | Kiawah Island-Seabrook Island | 2,096 |
| 2. | Fort Jackson | 1,678 |
| 3. | Wando | 1,532 |
| 4. | Mount Pleasant | 1,474 |
| 5. | Blythewood | 1,332 |