California
Maps & Population Facts
Housing Estimates
California is the most populated state in the United States and third largest by land area. The state is one of the largest economies in the world with a gross domestic product of about 3 trillion dollars. California plays a center role in the tech industry, with many of the largest tech companies in the world having their headquarters in the state. Agriculturally, California produces over 80 crops that generate between 25 million dollars to six billion dollars annually.
Residents of California earn more on average, but have one of the highest costs of living in the nation. California is the most expensive place to purchase a home in the continental United States.
Income
Households in the state of California earn more money than the national median income, averaging 19% higher per household.
Housing
California has a median house price of $509,400, which makes it one of the most expensive places in the United States to own property. The cost of renting in California is 43% more than the national average.
| Percent | Ranking | |
|---|---|---|
| Renter Occupied Households | 45% | 2nd |
| New Construction (Built after 2000) | 15% | 41st |
Demographics
The median age in the state is 37. The age of the general population in California is comparable with other US states.
California ranks better than average for having an educated population. The state has more college graduates per resident than most states.
Housing Data
| California | USA | |
| Median Property Value | 509,400 | 217,600 |
| Median Mortgage Payment | 2,269 | 1,513 |
| Median Gross Rent | 1,447 | 1,012 |
| Property Vacancy | 8.3% | 12.6% |
| % Renters | 45% | 36% |
| Residents per Sq. Mi. | 254 | 93 |
| California | USA | |
| Median Household Income | 71,805 | 60,336 |
| Median Individual Income | 35,544 | 33,646 |
| Median Income (Full-Time) | 50,807 | 46,881 |
| Median Age | 36.5 | 38.1 |
| Labor Participation | 62.6% | 62.8% |
| Attained College Degree | 33.6% | 32.0% |
Population Density Analysis


Demographics
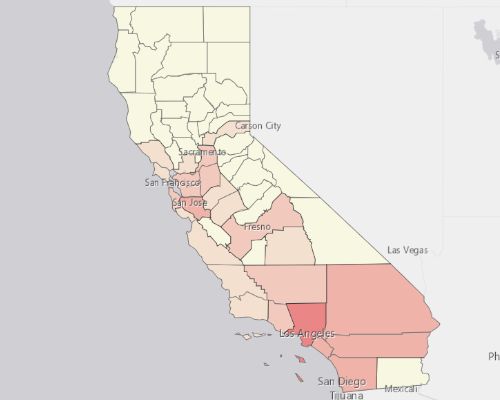
Most Populated Cities
| 1. | Los Angeles | 2,593,246 |
| 2. | San Diego | 2,405,695 |
| 3. | San Fernando Valley | 1,856,209 |
| 4. | San Jose | 1,779,562 |
| 5. | Anaheim-Santa Ana-Garden Grove | 1,704,937 |
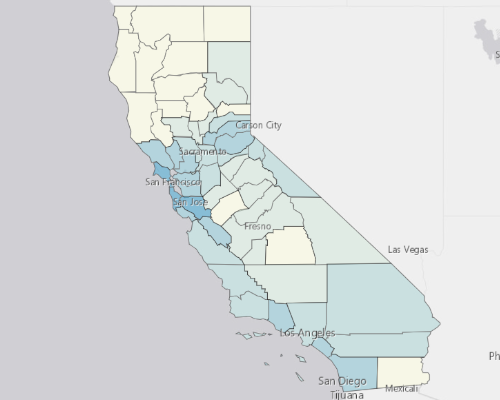
Highest Household Income
| 1. | West Santa Clara | 205,720 |
| 2. | Triunfo Pass-Point Mugu | 173,611 |
| 3. | Llagas-Uvas | 150,729 |
| 4. | Lexington Hills | 145,486 |
| 5. | Tassajara | 144,653 |
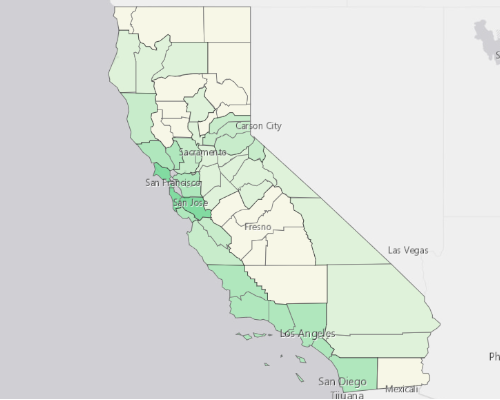
Highest Home Value
| 1. | Southeast Marin | 1,267,600 |
| 2. | Bolinas | 1,216,800 |
| 3. | Santa Monica | 1,168,500 |
| 4. | San Mateo | 1,132,500 |
| 5. | Carmel-By-The-Sea | 1,114,000 |
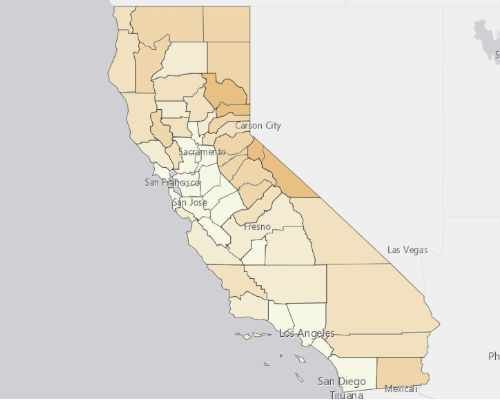
Highest Gross Rent
| 1. | Triunfo Pass-Point Mugu | 3,341 |
| 2. | West Santa Clara | 2,780 |
| 3. | Toro Park | 2,611 |
| 4. | Agoura Hills-Malibu | 2,263 |
| 5. | Tassajara | 2,194 |