Mississippi
Maps & Population Facts
Housing Estimates
Located on the Gulf Coast, Mississippi is the 34th most populated state. Mississippi has a corporate tax rate that is lower than average and housing costs are of the lowest in the nation. The state has weak economic signals ranking in the lowest percentile for household income, labor force participation and educational attainment.
Mississippi is a top producer of soybeans producing over a billion dollars of the crop annually. In addition, over 250 million pounds of fish are processed through Mississippi fisheries annually.
Income
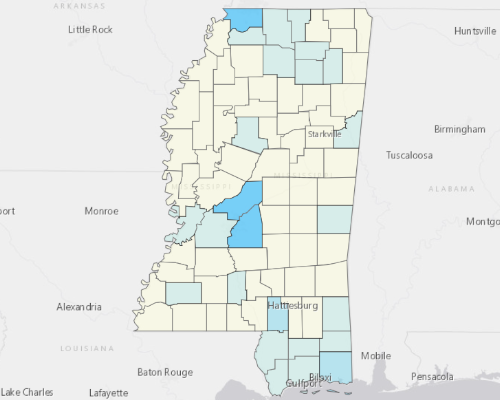
Households in the state of Mississippi earn signifcantly less money than the national median income, averaging 28% less per household.
Housing
Mississippi has a median house price of $120,200. The cost of homeownership is significantly less than most states. The cost of renting in Mississippi is 27% less than the national average.
| Percent | Ranking | |
|---|---|---|
| Renter Occupied Households | 31% | 36th |
| New Construction (Built after 2000) | 23% | 14th |
Demographics
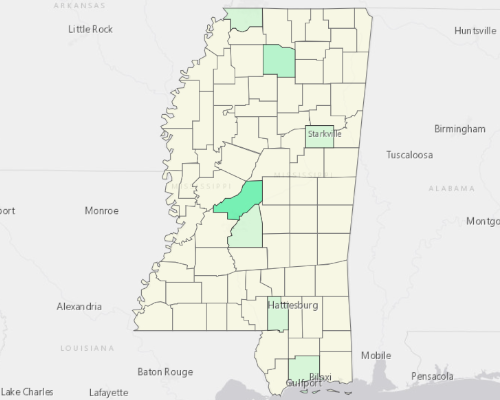
The median age in the state is 38. The age of the general population in Mississippi is comparable with other US states.
Mississippi ranks in the lowest of the nation for having an educated population. The state has significantly less college graduates per resident than most states.
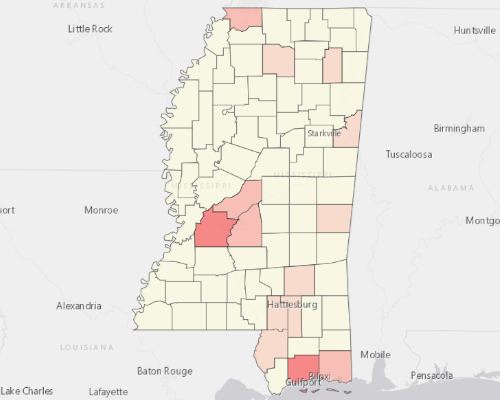
Housing Data
| Mississippi | USA | |
| Median Property Value | 120,200 | 217,600 |
| Median Mortgage Payment | 1,090 | 1,513 |
| Median Gross Rent | 742 | 1,012 |
| Property Vacancy | 17.5% | 12.6% |
| % Renters | 31% | 36% |
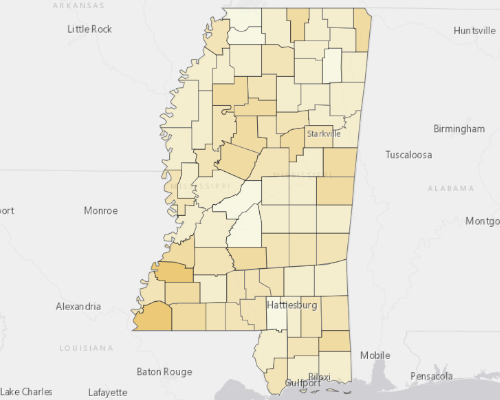
| Residents per Sq. Mi. | 64 | 93 |
| Mississippi | USA | |
| Median Household Income | 43,529 | 60,336 |
| Median Individual Income | 29,818 | 33,646 |
| Median Income (Full-Time) | 37,655 | 46,881 |
| Median Age | 37.5 | 38.1 |
| Labor Participation | 55.2% | 62.8% |
| Attained College Degree | 21.9% | 32.0% |
Population Density Analysis


Demographics
Most Populated Cities
| 1. | District 4 | 66,036 |
| 2. | District 1 | 51,405 |
| 3. | District 2 | 50,787 |
| 4. | District 1 | 48,972 |
| 5. | District 5 | 43,676 |
Highest Household Income
| 1. | District 3 | 100,897 |
| 2. | District 4 | 92,500 |
| 3. | District 2 | 84,054 |
| 4. | District 2 | 81,926 |
| 5. | District 5 | 71,579 |
Highest Home Value
| 1. | District 3 | 308,500 |
| 2. | District 4 | 238,400 |
| 3. | District 2 | 215,900 |
| 4. | District 1 | 210,700 |
| 5. | District 4 | 207,100 |
Highest Gross Rent
| 1. | District 3 | 1,299 |
| 2. | District 2 | 1,249 |
| 3. | District 1 | 1,131 |
| 4. | District 2 | 1,130 |
| 5. | District 3 | 1,018 |