North Dakota
Maps & Population Facts
Housing Estimates
North Dakota is the fourth least populated State in the United States and has an economy is that is largely based on farming. North Dakota is a top producer of soybeans, wheat and corn. North Dakota has one of the lowest unemployment rates in the nation and also has one of the lowest corporate tax rates.
The population of North Dakota is much younger and has more labor force participants as a percentage of the total population than most states. Despite being one of the least populated states, North Dakota has experienced a population spike since 2010 seeing over a 10% increase.
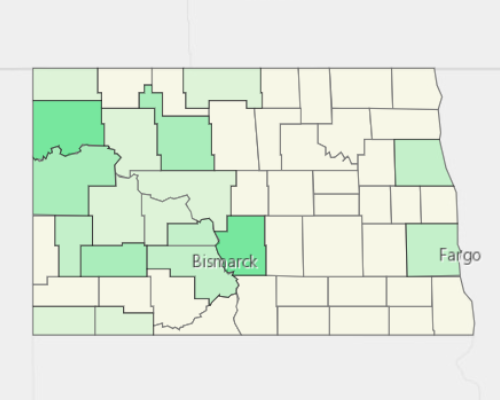
Income
Households in the state of North Dakota earn more money than the national median income, averaging 2% higher per household.
Housing
North Dakota has a median house price of $194,700. The cost of homeownership is slightly less than most states. The cost of renting in North Dakota is 22% less than the national average.
| Percent | Ranking | |
|---|---|---|
| Renter Occupied Households | 37% | 11th |
| New Construction (Built after 2000) | 26% | 10th |
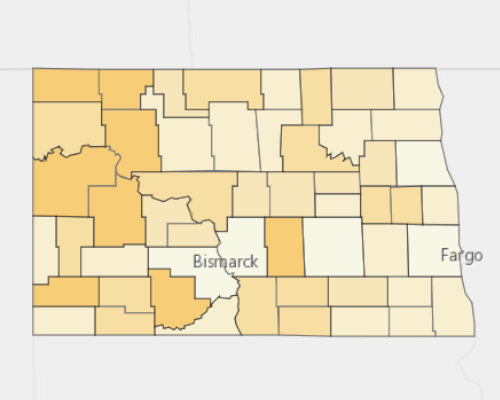
Demographics
The median age in the state is 35. North Dakota has a population that is younger than in comparison to the US median age.
North Dakota ranks average for having an educated population. The percent of residents who have a college degree is comparable with other states.
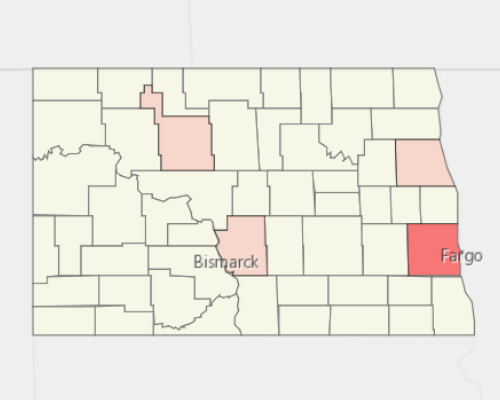
Housing Data
| North Dakota | USA | |
| Median Property Value | 194,700 | 217,600 |
| Median Mortgage Payment | 1,356 | 1,513 |
| Median Gross Rent | 785 | 1,012 |
| Property Vacancy | 15.6% | 12.6% |
| % Renters | 37% | 36% |
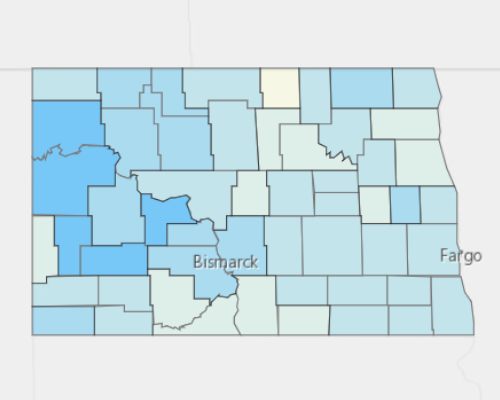
| Residents per Sq. Mi. | 11 | 93 |
| North Dakota | USA | |
| Median Household Income | 61,843 | 60,336 |
| Median Individual Income | 35,999 | 33,646 |
| Median Income (Full-Time) | 47,133 | 46,881 |
| Median Age | 35.4 | 38.1 |
| Labor Participation | 69.4% | 62.8% |
| Attained College Degree | 30.7% | 32.0% |
Population Density Analysis


Demographics
Most Populated Cities
| 1. | Fargo City | 118,099 |
| 2. | Bismarck | 70,536 |
| 3. | Grand Forks City | 56,236 |
| 4. | Minot | 48,171 |
| 5. | West Fargo | 33,089 |
Highest Household Income
| 1. | Blooming Valley | 247,930 |
| 2. | Montrose | 230,625 |
| 3. | Page Township | 228,056 |
| 4. | Porter | 220,278 |
| 5. | Neche Township | 216,250 |
Highest Home Value
| 1. | Golden Valley | 847,200 |
| 2. | Grenora Township | 553,600 |
| 3. | Alex | 545,500 |
| 4. | Southeast Mckenzie | 483,300 |
| 5. | Van Buren | 475,000 |
Highest Gross Rent
| 1. | Oxbow | 1,875 |
| 2. | Waterford | 1,741 |
| 3. | Harrison | 1,677 |
| 4. | Deering City | 1,563 |
| 5. | Tatman | 1,481 |